

Key takeaways:
-
XRP has averaged 25% declines in 2025 following overbought Stochastic RSI signals.
-
A descending triangle breakdown could push the XRP price toward $1.14, while an analyst sees a deeper drop to $0.60.
-
Bullish analysts expect breakouts toward $3.20–$27.
XRP (XRP) has averaged 25% price declines in 2025 during its daily Stochastic RSI unwinding from the overbought levels. A similar fractal is now playing out in July, raising the probability of correcting in the coming days or weeks.
Previous XRP drops were between 12% and 45%
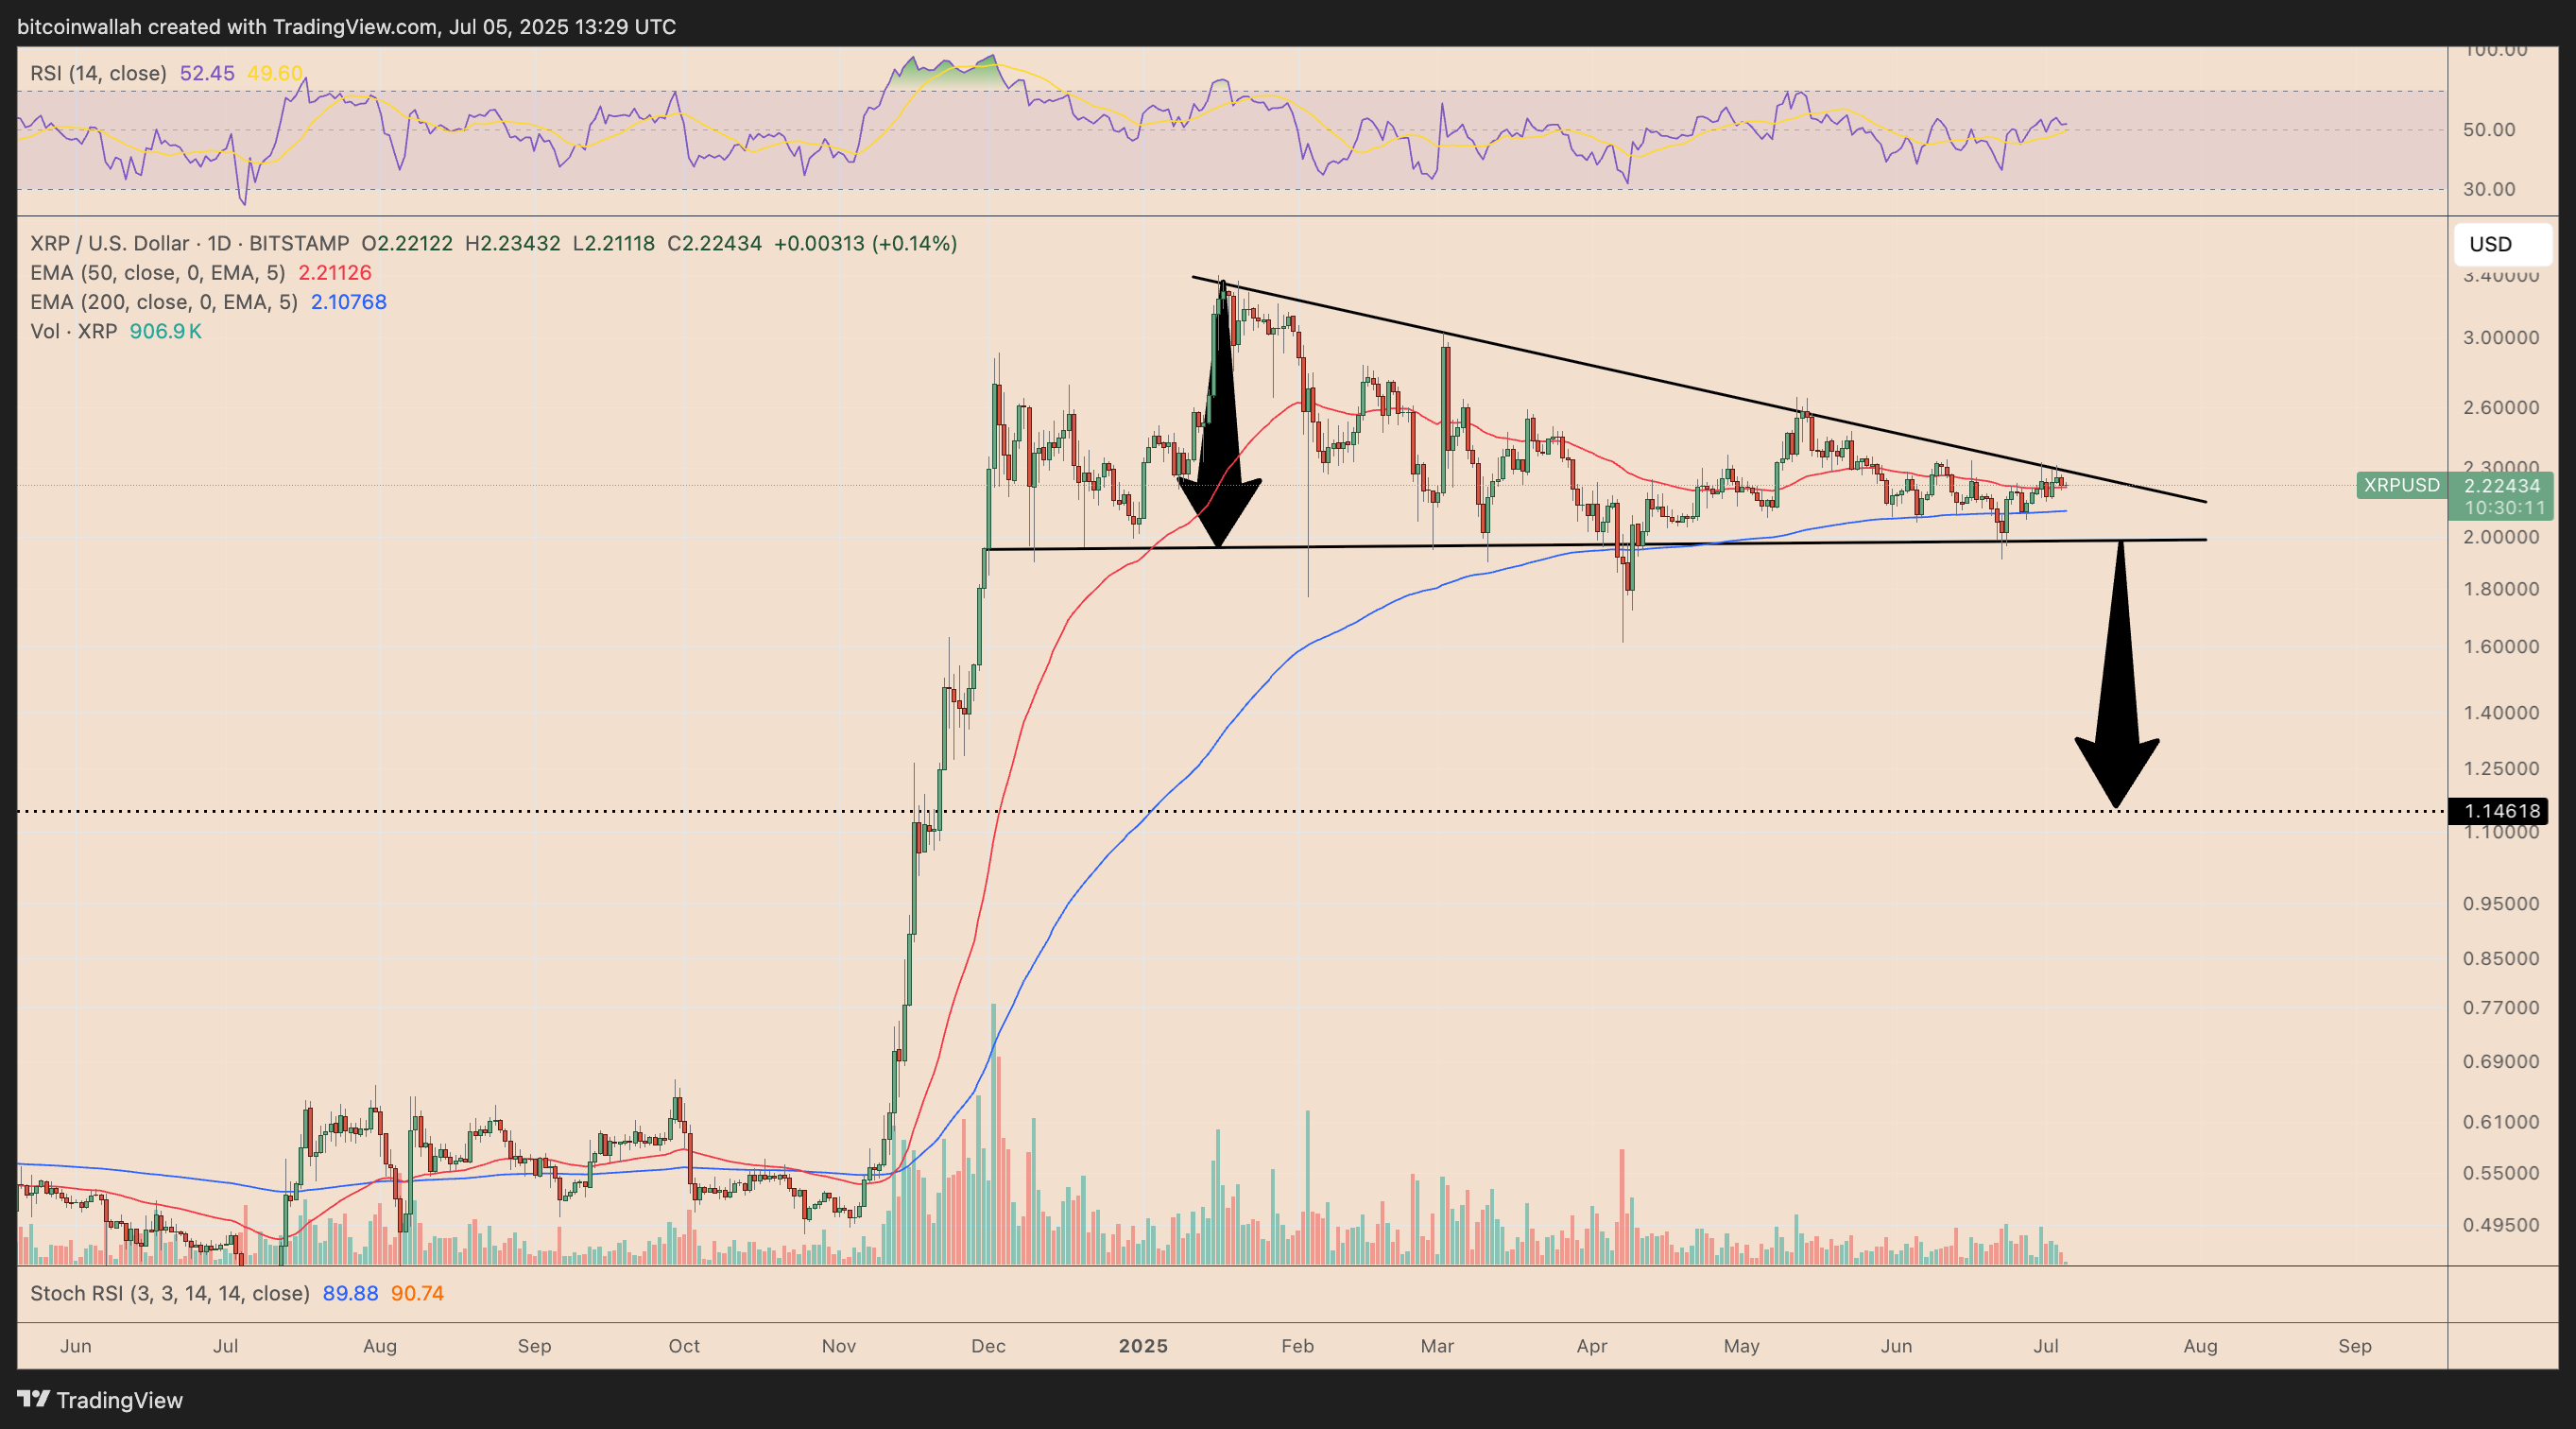
Stochastic RSI measures momentum by comparing an asset’s RSI to its recent range. Its reading crossed into the overbought zone above 80 on XRP’s daily chart on June 28 and has been there since then.
Previous instances show that XRP tends to reverse sharply when these levels begin to neutralize. The cryptocurrency’s declines have come to be approximately 12-45% in 2025, averaging over 25%.
XRP’s chart structure implies a higher probability of downside unless a decisive breakout invalidates this chart signal.
XRP 50-70% drawdown risks remain
A descending triangle formation after XRP’s strong upside run risks strengthening the bearish outlook, with downside projections sitting at around $1.14, or 50% from the current price levels.
Analyst Xanrox warns of a much deeper correction ahead, citing a multi-year ascending triangle that has defined XRP’s price action since 2017.
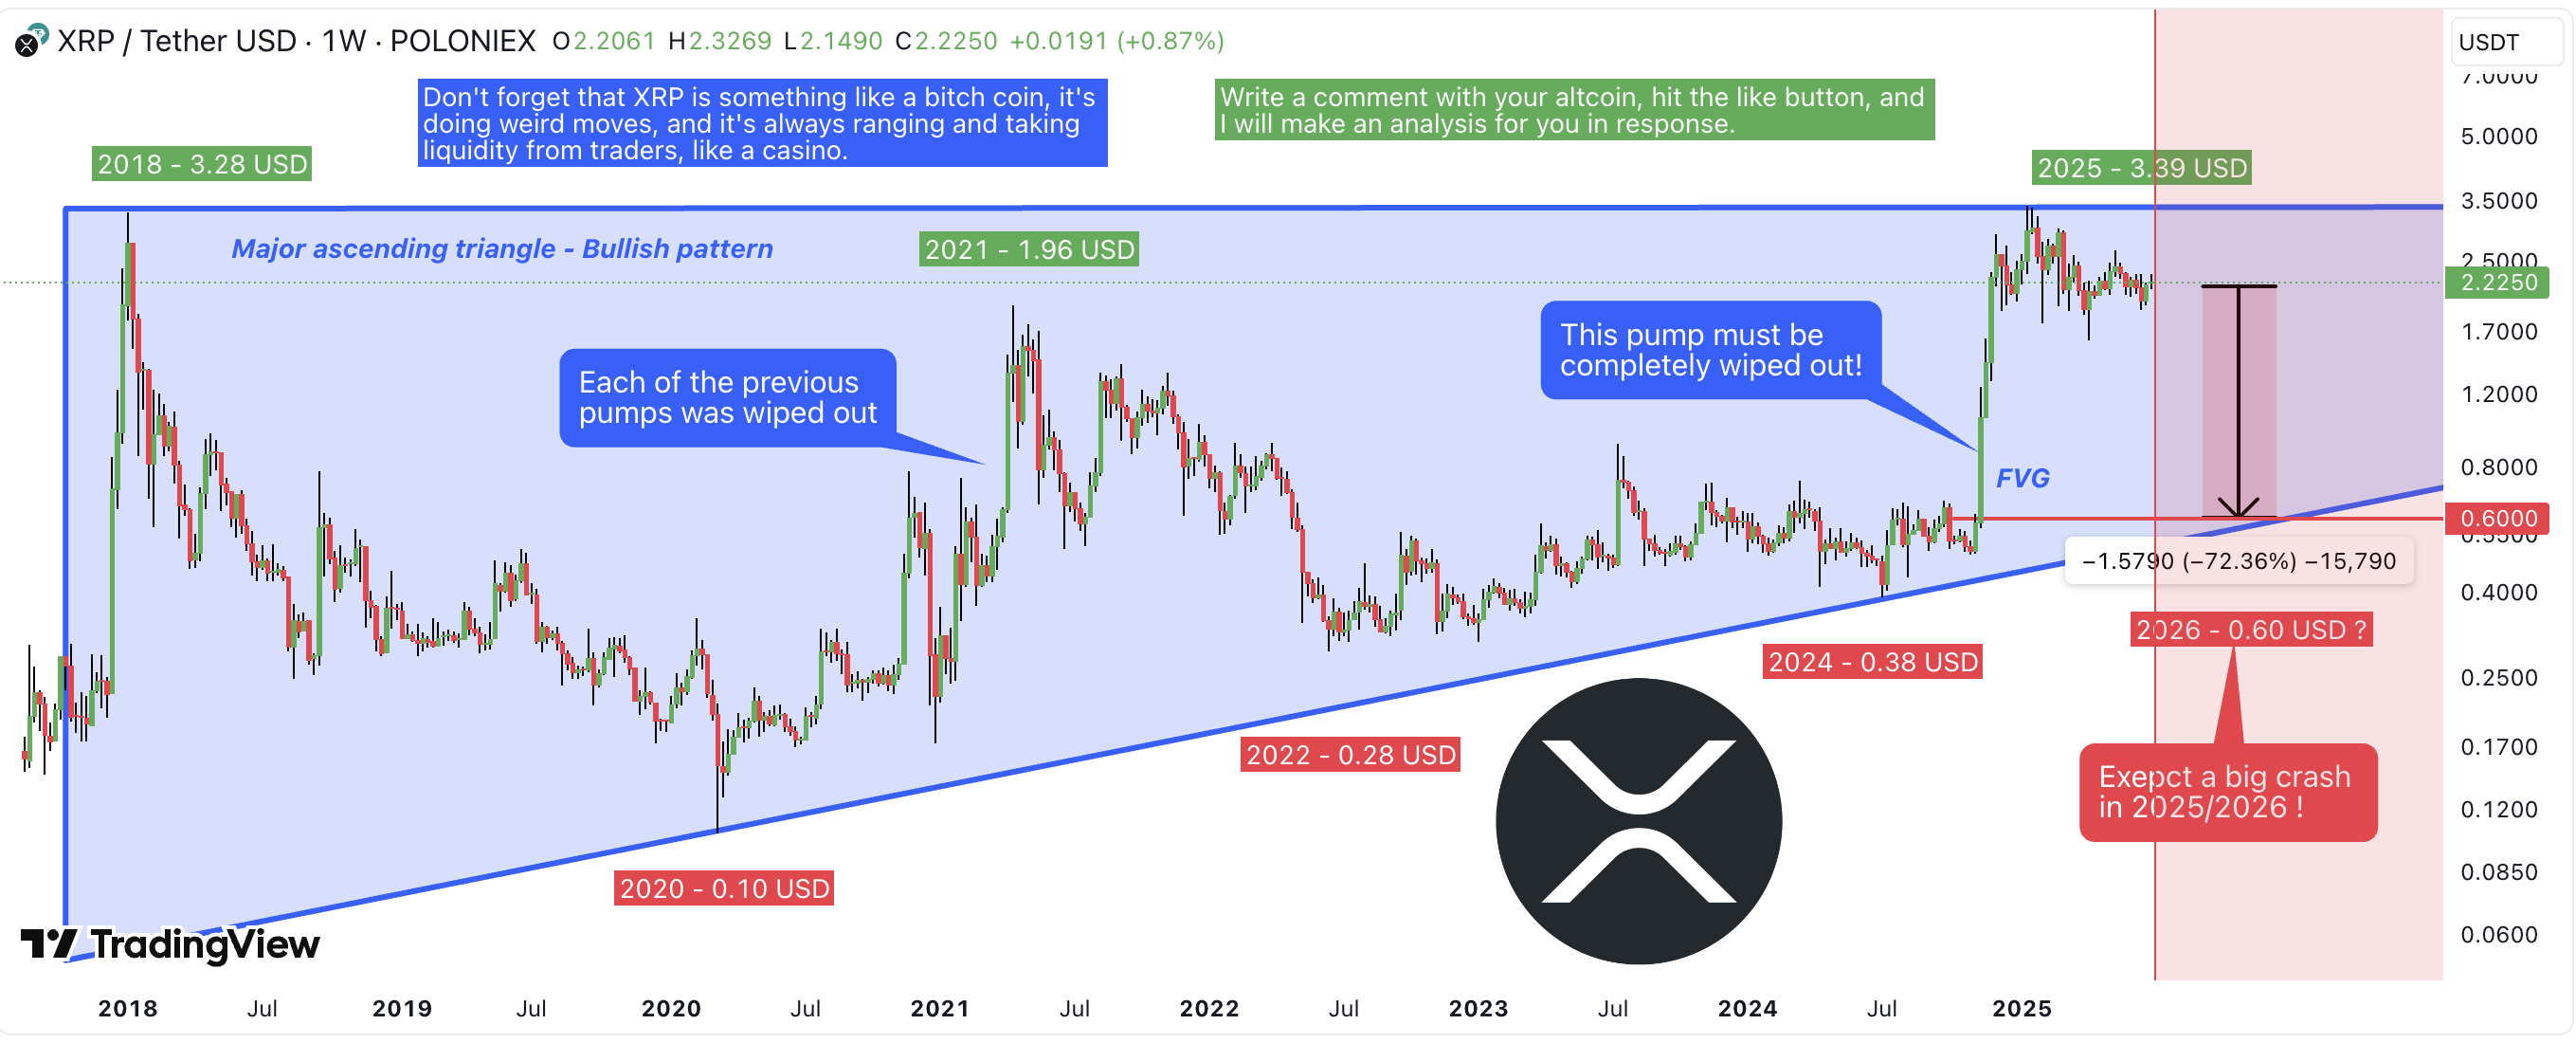
A key part of his thesis is the formation of a large Fair Value Gap, or FVG, during XRP’s vertical move earlier this year. Historically, such imbalances have been filled aggressively after steep drawdowns.
Related: XRP futures OI jumps 30% as price chart ‘pennant’ targets $3.20
He projects a similar outcome following XRP’s recent rally to $3.40 in 2025, targeting a decline toward the triangle’s lower trendline at around $0.60, a ~70% drawdown from current prices.
Not all analysts are bearish, however. Mikybull Crypto sees a symmetrical triangle setup targeting $3.70 by September, while XForceGlobal projects $8–27 based on Fibonacci levels.
Others cite a falling wedge breakout and whale accumulation, with targets near $3.20.
This article does not contain investment advice or recommendations. Every investment and trading move involves risk, and readers should conduct their own research when making a decision.